Homeassistant, InfluxDB 2.x and Grafana

I installed grafana the same way I installed InfluxDB (described in a post last year) via the ArchLinux package and activated the systemd service. On first connection with default settings (browse to http://ip-address:3000) the login is admin/admin, but the password has to be changed on first login.

First the database connection. I of course want to use the InfluxDB but I chose "Flux" as query system. The only things in the dialog that needs to be filled in are the url: http://localhost:8086 and the InfluxDB Details.

To fill this we need the org, the bucket and a token. For this I used the influx-cli:

# get the orgs
influx orgs list

# get the buckets
influx bucket list

# create a readonly token for grafana
influx auth create --org hass --read-bucket 62302b4f139a4971 --description grafana-ro

Next is creating a dashboard with visualizations. The flux language is a bit strange and quite different from InfluxQL.

So we want to explore what data we have by activating the table view and for example list the possible measurements:

import "influxdata/influxdb/schema"
schema.measurements(bucket: "home_assistant")

A lot of sensors are stored by their meassurements, i.e. "°C", "%", others by their name, i.e. "binary_sensor.madflex_de" (uptime monitor), "weather.forecast_home" or "zone.home". For more exploration see here: https://docs.influxdata.com/influxdb/cloud/query-data/flux/explore-schema/.

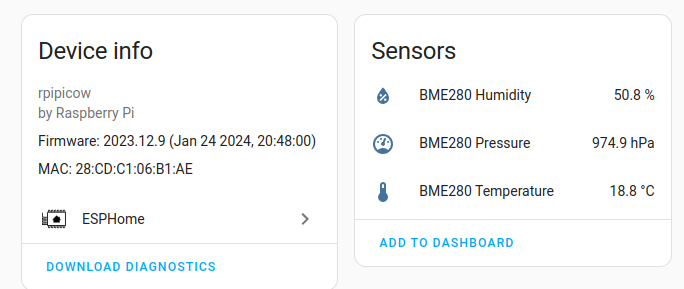
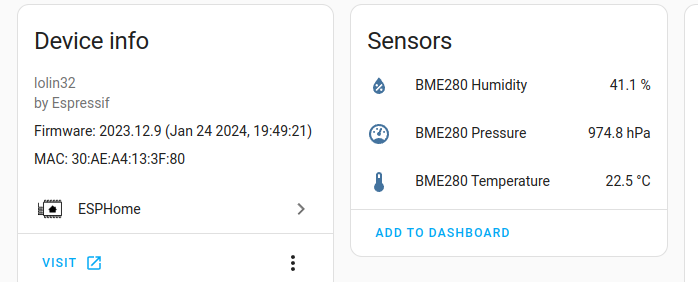
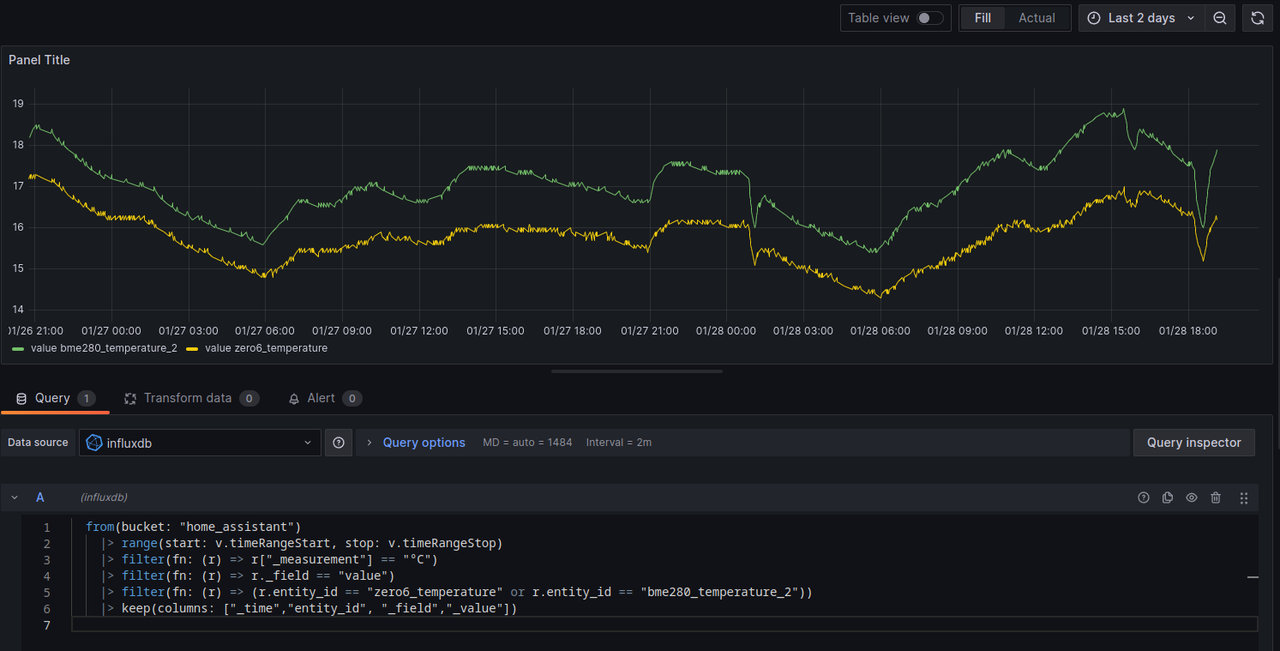
I deployed a second sensor in the kitchen that uses ESPHome, see previous blog post, and now I want to see how different they are. I assume a bit of difference because of the location but otherwise a similar curve. The code to see the temperature of sensors filtered by enitity_id and exactly the two sensors in the kitchen selected:

from(bucket: "home_assistant")
  |> range(start: v.timeRangeStart, stop: v.timeRangeStop)
  |> filter(fn: (r) => r["_measurement"] == "°C")
  |> filter(fn: (r) => r._field == "value")
  |> filter(fn: (r) => (r.entity_id == "zero6_temperature" or r.entity_id == "bme280_temperature_2"))
  |> keep(columns: ["_time","entity_id", "_field","_value"])

img1

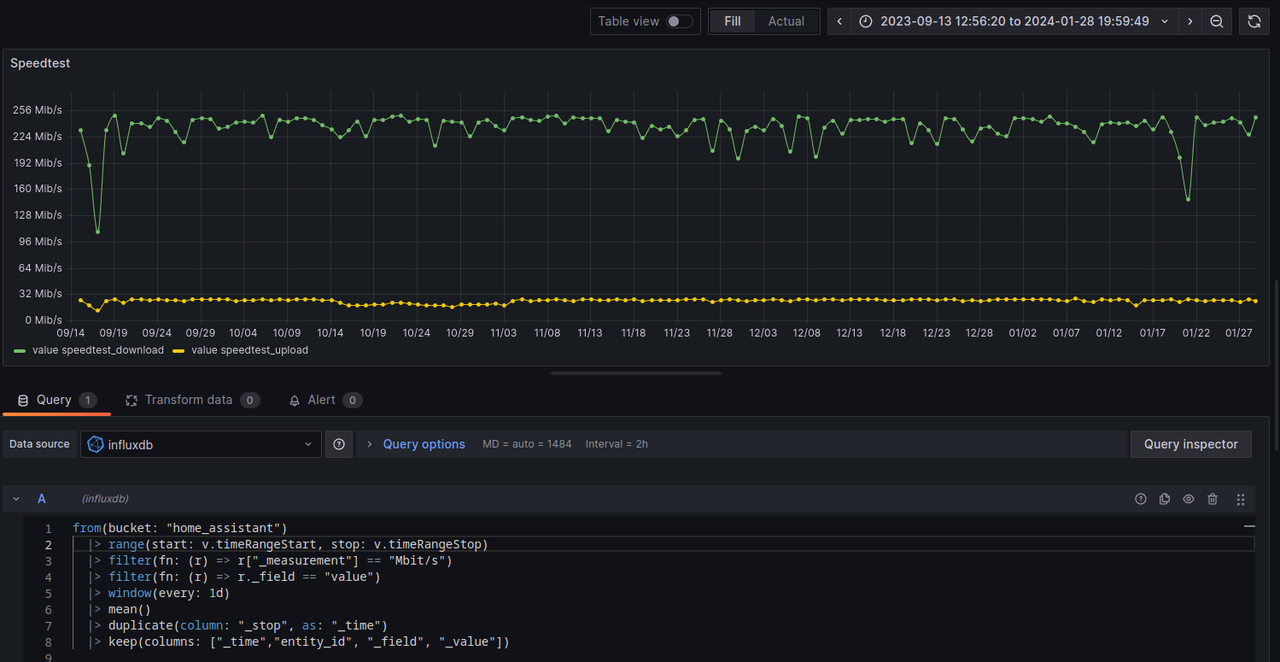
Another example is a graph for upload/download speed of the speedtest integration:

from(bucket: "home_assistant")
  |> range(start: v.timeRangeStart, stop: v.timeRangeStop)
  |> filter(fn: (r) => r["_measurement"] == "Mbit/s")
  |> filter(fn: (r) => r._field == "value")
  // add windowing
  |> window(every: 1d)
  |> mean()
  // duplicate _time so we can plot again
  |> duplicate(column: "_stop", as: "_time")
  |> keep(columns: ["_time","entity_id", "_field", "_value"])

The plot shows all speedtest data I have currently, with mean() value per day to remove the jitter in the very long timeframe.

img2

And a third one, the status of a binary sensor -- choosing one that actually changes: binary_sensor.home_assistant_versions_update_available:

from(bucket: "home_assistant")
|> range(start: v.timeRangeStart, stop: v.timeRangeStop)
|> filter(fn: (r) => r["_measurement"] == "binary_sensor.home_assistant_versions_update_available")
|> filter(fn: (r) => r._field == "value")
|> keep(columns: ["_time","entity_id", "_field","_value"])

A timeseries plot didn't work here, but a barplot does:

img3

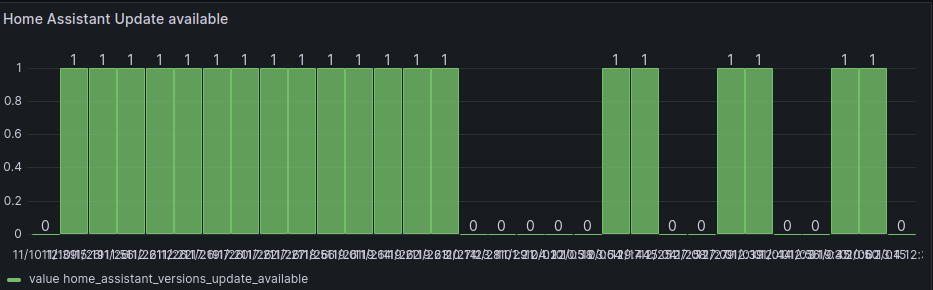
The value update_available seems to be pushed irregular, so this plot is probably not very helpful.

Overall Grafana is a cool addon to InfluxDB. The "new" InfluxDB query language Flux is very much noch SQL and I don't really like it. Probably because of my 25+ years of SQL experience.

ESPHome: Raspberry PI Pico W

Another device I have lying around is a Raspberry PI Pico W which is the version with Wifi and Bluetooth. Running ESPHome on this small and cheap microcontrollers is not mature yet, but it works.

I followed some of the instructions from Koen Vervloesem in his post about the Pico and ESPHome. The wizard still doesn't work, but I didn't want to use the dashboard. So I started copy/pasting a yaml for my Pico W which looks like this:

esphome:
  name: pico2

rp2040:
  board: rpipicow
  framework:
    platform_version: https://github.com/maxgerhardt/platform-raspberrypi.git

api:
  password: ""

wifi:
  ssid: !secret wifi_ssid
  password: !secret wifi_password

i2c:
  sda: 20
  scl: 21

sensor:
  - platform: bme280
    temperature:
      name: "BME280 Temperature"
    pressure:
      name: "BME280 Pressure"
    humidity:
      name: "BME280 Humidity"
    address: 0x76

Most of the setup is the same as in the previous post for an ESP32. The differences are the board and the i2c ports. There is no automatic upload yet because the Pico works a bit differently. When in boot mode (pressing the button and then connect to the PC) the Pico connects as a drive. To change the firmware an uf2-file needs to be copied on the device and when finished the Pico reboots. To get this file I used this Docker command and copied the file to the drive:

docker compose run --rm esphome compile pico2.yaml
cp config/.esphome/build/pico2/.pioenvs/pico2/firmware.uf2 /run/media/mfa/RPI-RP2/

After the automatic reboot the Pico is discovered by Homeassistant and everything works the same way as for an ESP32.

img1

ESPHome: Wemos ESP32 OLED

My Homeassistant setup works, but I actually want to use some of the Rasperry PIs for something else, so it is time to replace them. A few years back I bought an ESP32 with OLED display. Not exactly this one, but similar to the one used in this tutorial: https://www.instructables.com/ESP32-With-Integrated-OLED-WEMOSLolin-Getting-Star/. Connecting a BME280 to this and installing ESPHome should be easy. And it actually is, except the OLED which I haven't figured out yet.

But first how I got ESPHome on the ESP32. I used the Docker version on a Linux system, so I can use ttyUSB directly. Setup up the device by using the Wizard and then running the first install via USB. I actually updated via USB later too, even with a working wifi setup, because it just worked.

My yaml configuration for the Wemos Lolin ESP32 OLED:

esphome:
  name: wemos1

esp32:
  board: lolin32
  framework:
    type: arduino

# Enable Home Assistant API
api:
  password: ""

wifi:
  ssid: !secret wifi_ssid
  password: !secret wifi_password

# set i2c ports
i2c:
  sda: 4
  scl: 5

sensor:
  - platform: bme280
    temperature:
      name: "BME280 Temperature"
      oversampling: 16x
    pressure:
      name: "BME280 Pressure"
    humidity:
      name: "BME280 Humidity"
    address: 0x76
    update_interval: 60s

# run webserver
web_server:
  port: 80
  local: true

The I2C ports are not the default -- they are GPIO 4 and GPIO 5. The BME280 sensor is using port 0x76 (same as on my Raspberry PIs). The API is activated for Homeassistant without a password (no one except me is in this wifi). And on the Homeassistant side this just works. I got a notification that there is a new integration, accepted it and the sensor values are shown like this:

img1

And finally I activated the web server on port 80 with bundled assets for local (no internet) usage. The website looks like this:

img2

Overall a positive experience. Except for the OLED display. I am pretty sure the values I tried are correct because this is very much standard, but it doesn't work. Maybe in the future I try to use the Arduino Plattform or Circuit-Python to figure out what the correct values are, but not today.

Link to the repo with the yaml file including the OLED display experiments: https://github.com/mfa/ha-sensors/tree/main/esphome/config/wemos1.yaml.